All projects · Mercedes-Benz España
Production line control screens
A list you can read from far away, on the shop floor and from any browser.
- Client
- Mercedes-Benz España
- Year
- 2002
- Industry
- Automotive / Industry
- Role
- Development · UX-UI
- Partner
- Beta Solutions
- Plant
- Vitoria
- Format
- Shop-floor screens in kiosk mode (1920 × 1080) and remote web
- Users
- Operators, shift supervisors and plant management
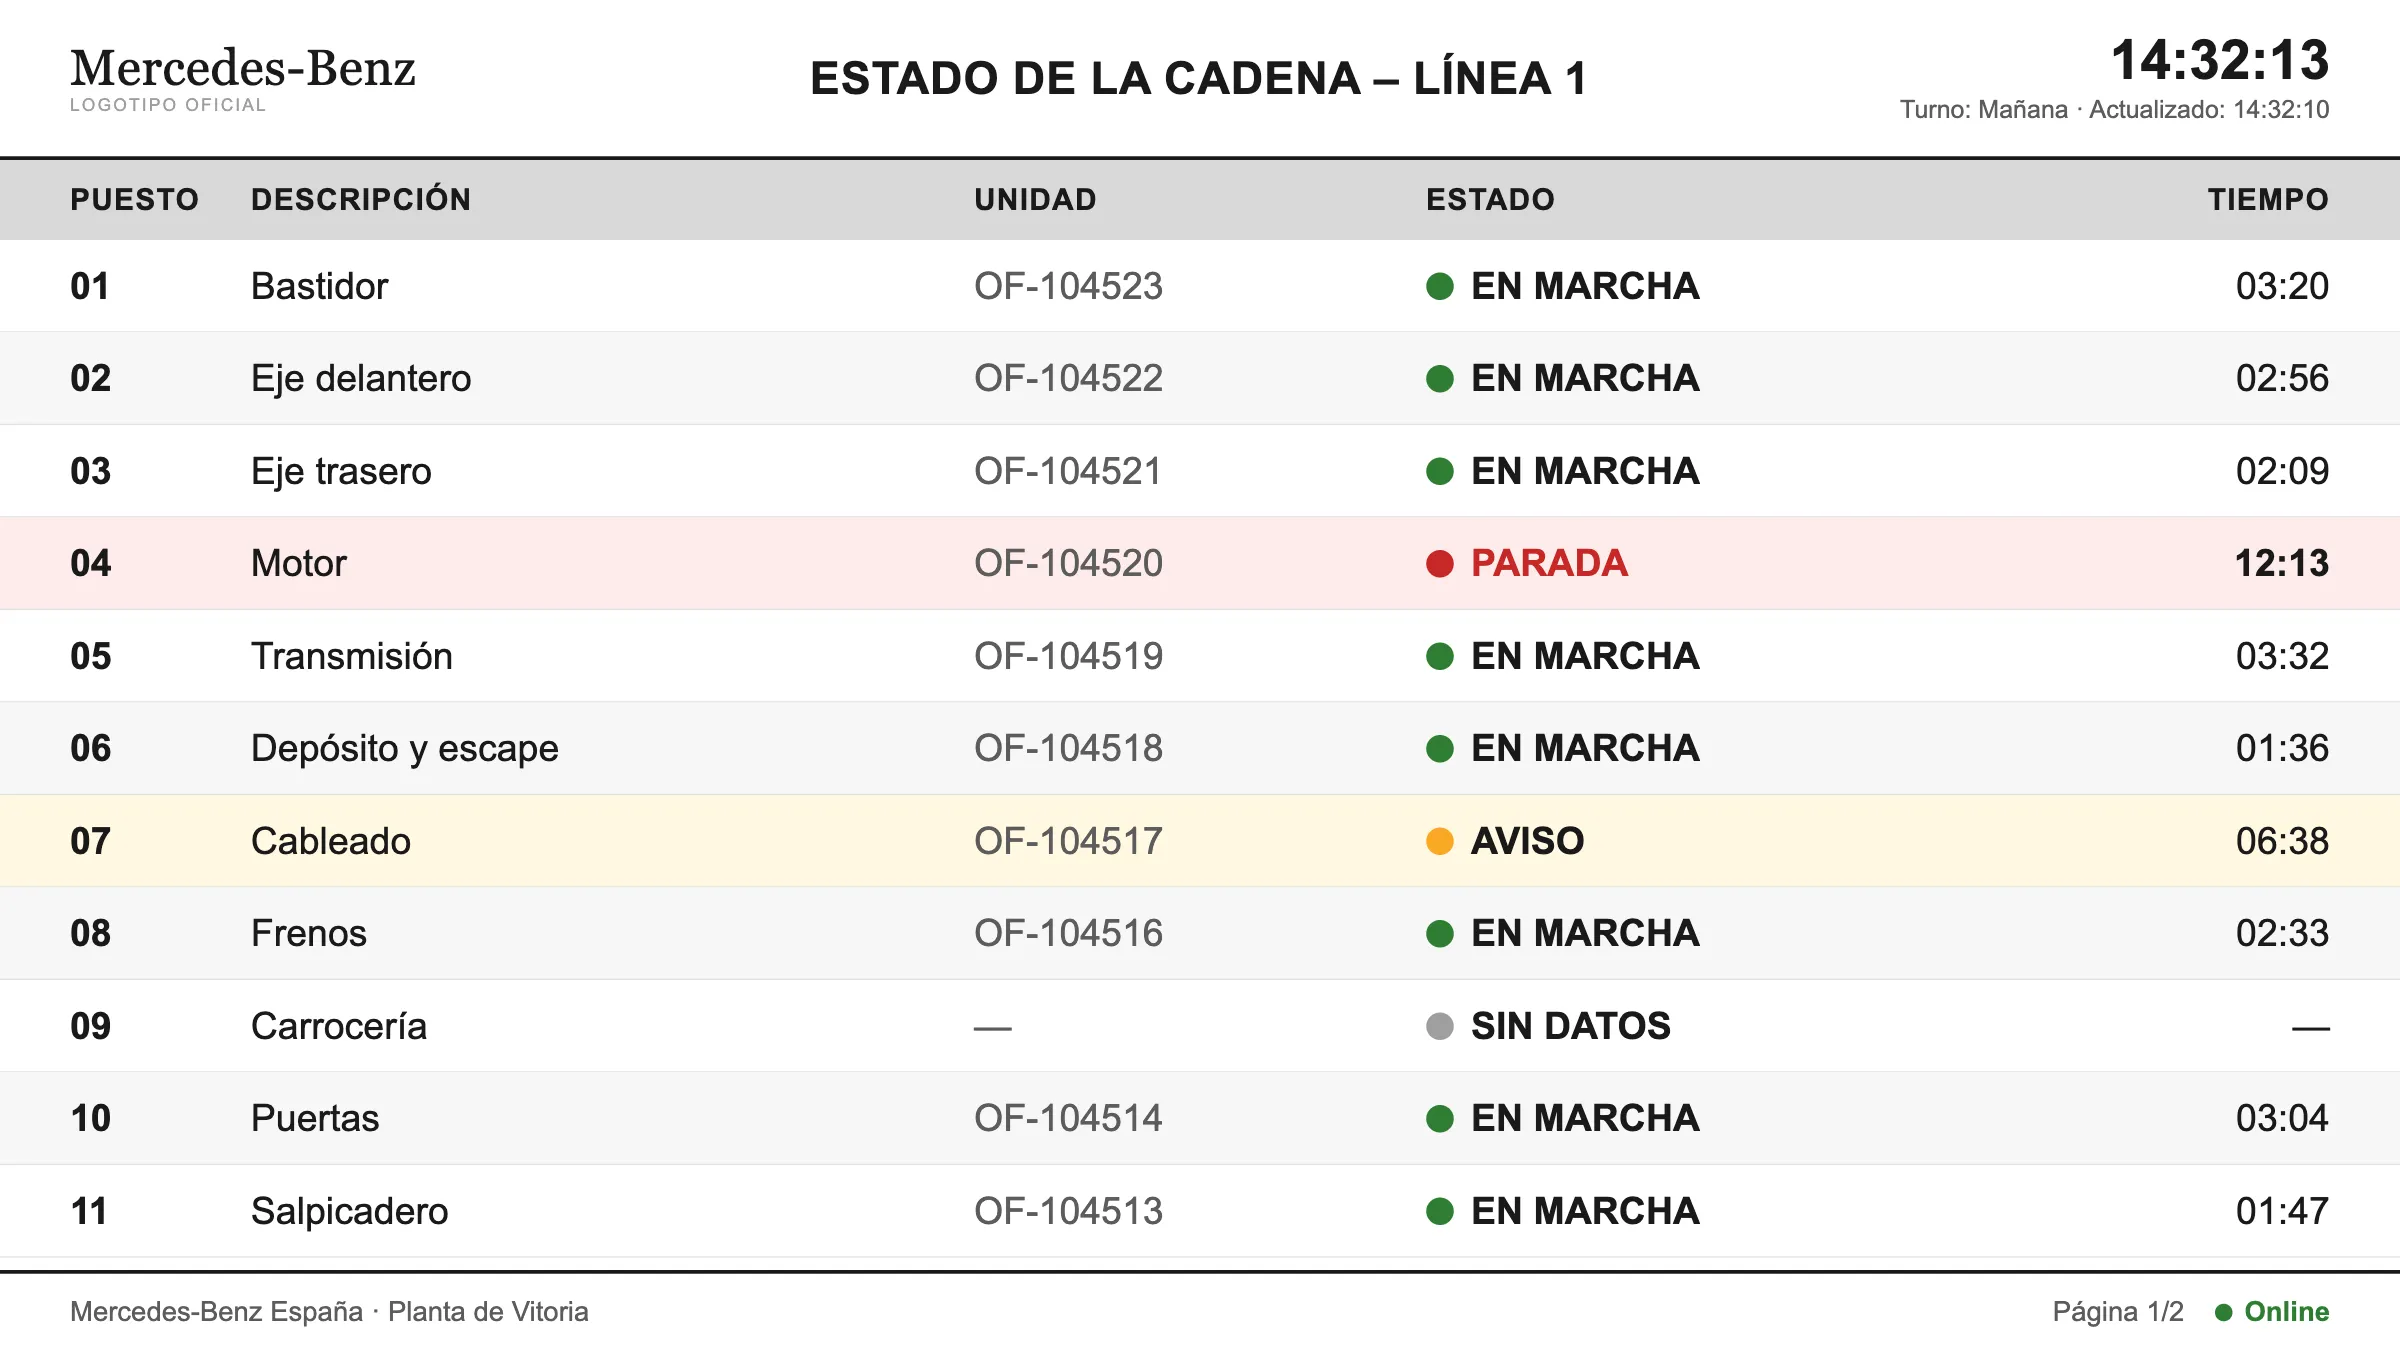
Line status by station · shop-floor screen
Every station with its unit, its status and the time spent in it. Stoppages and warnings are highlighted on the row, and the screen pages on its own.
Summary
We built a system to show the status of a van assembly line using standard web technology. Instead of the usual graphical dashboard, we chose list-format screens, with a white background and the Mercedes-Benz logo in the header, showing the status of every line, station and production order in a readable, continuous way.
The system was available both on the shop-floor screens and from any browser through a remote URL, so managers could follow production without being physically in the plant.
Key decisions
| Decision | Discarded alternative | Reason |
|---|---|---|
| List format | Dashboard with charts and gauges | A list shows many stations at a glance, reads well from a distance and needs no interpretation |
| White background with corporate identity | Dark control-room background | Consistent with the Mercedes-Benz image and more legible in a well-lit plant |
| Web technology (HTML5 + PHP + MySQL) | Desktop software or proprietary SCADA | Low cost and nothing to install: any screen with a browser works |
| Access through a remote URL | Plant intranet only | Managers can follow production from outside the plant |
Architecture
Status changes from the plant reach a MySQL database. A web server with PHP generates the list views and serves the data for refreshing, and those same views are shown in two places: the shop-floor screens, in kiosk mode with automatic refresh, and any remote browser, with authentication.
Use cases
- See the line status on the shop floor: every station with its current unit, its status and the time spent in it, refreshed automatically.
- Spot a stoppage: the row is highlighted in red with the reason and a minute counter, and moves to the top of the incidents. With no reason given, it shows "No reason assigned" until someone reports it.
- Check shift progress: per line, units produced, the target and the difference.
- Access remotely: the same views as in the plant, with user and password, read-only.
- Maintain the configuration: lines, stations, statuses, stoppage reasons and users.
Requirements
- Legible from a distance: large type and high contrast.
- Automatic refresh, with no user action.
- Lightweight: runs on simple display hardware.
- Available during every production shift.
- Remote access cannot modify data.
- A history of status changes, to analyse stoppages afterwards.
Screens
Data shown is anonymized.
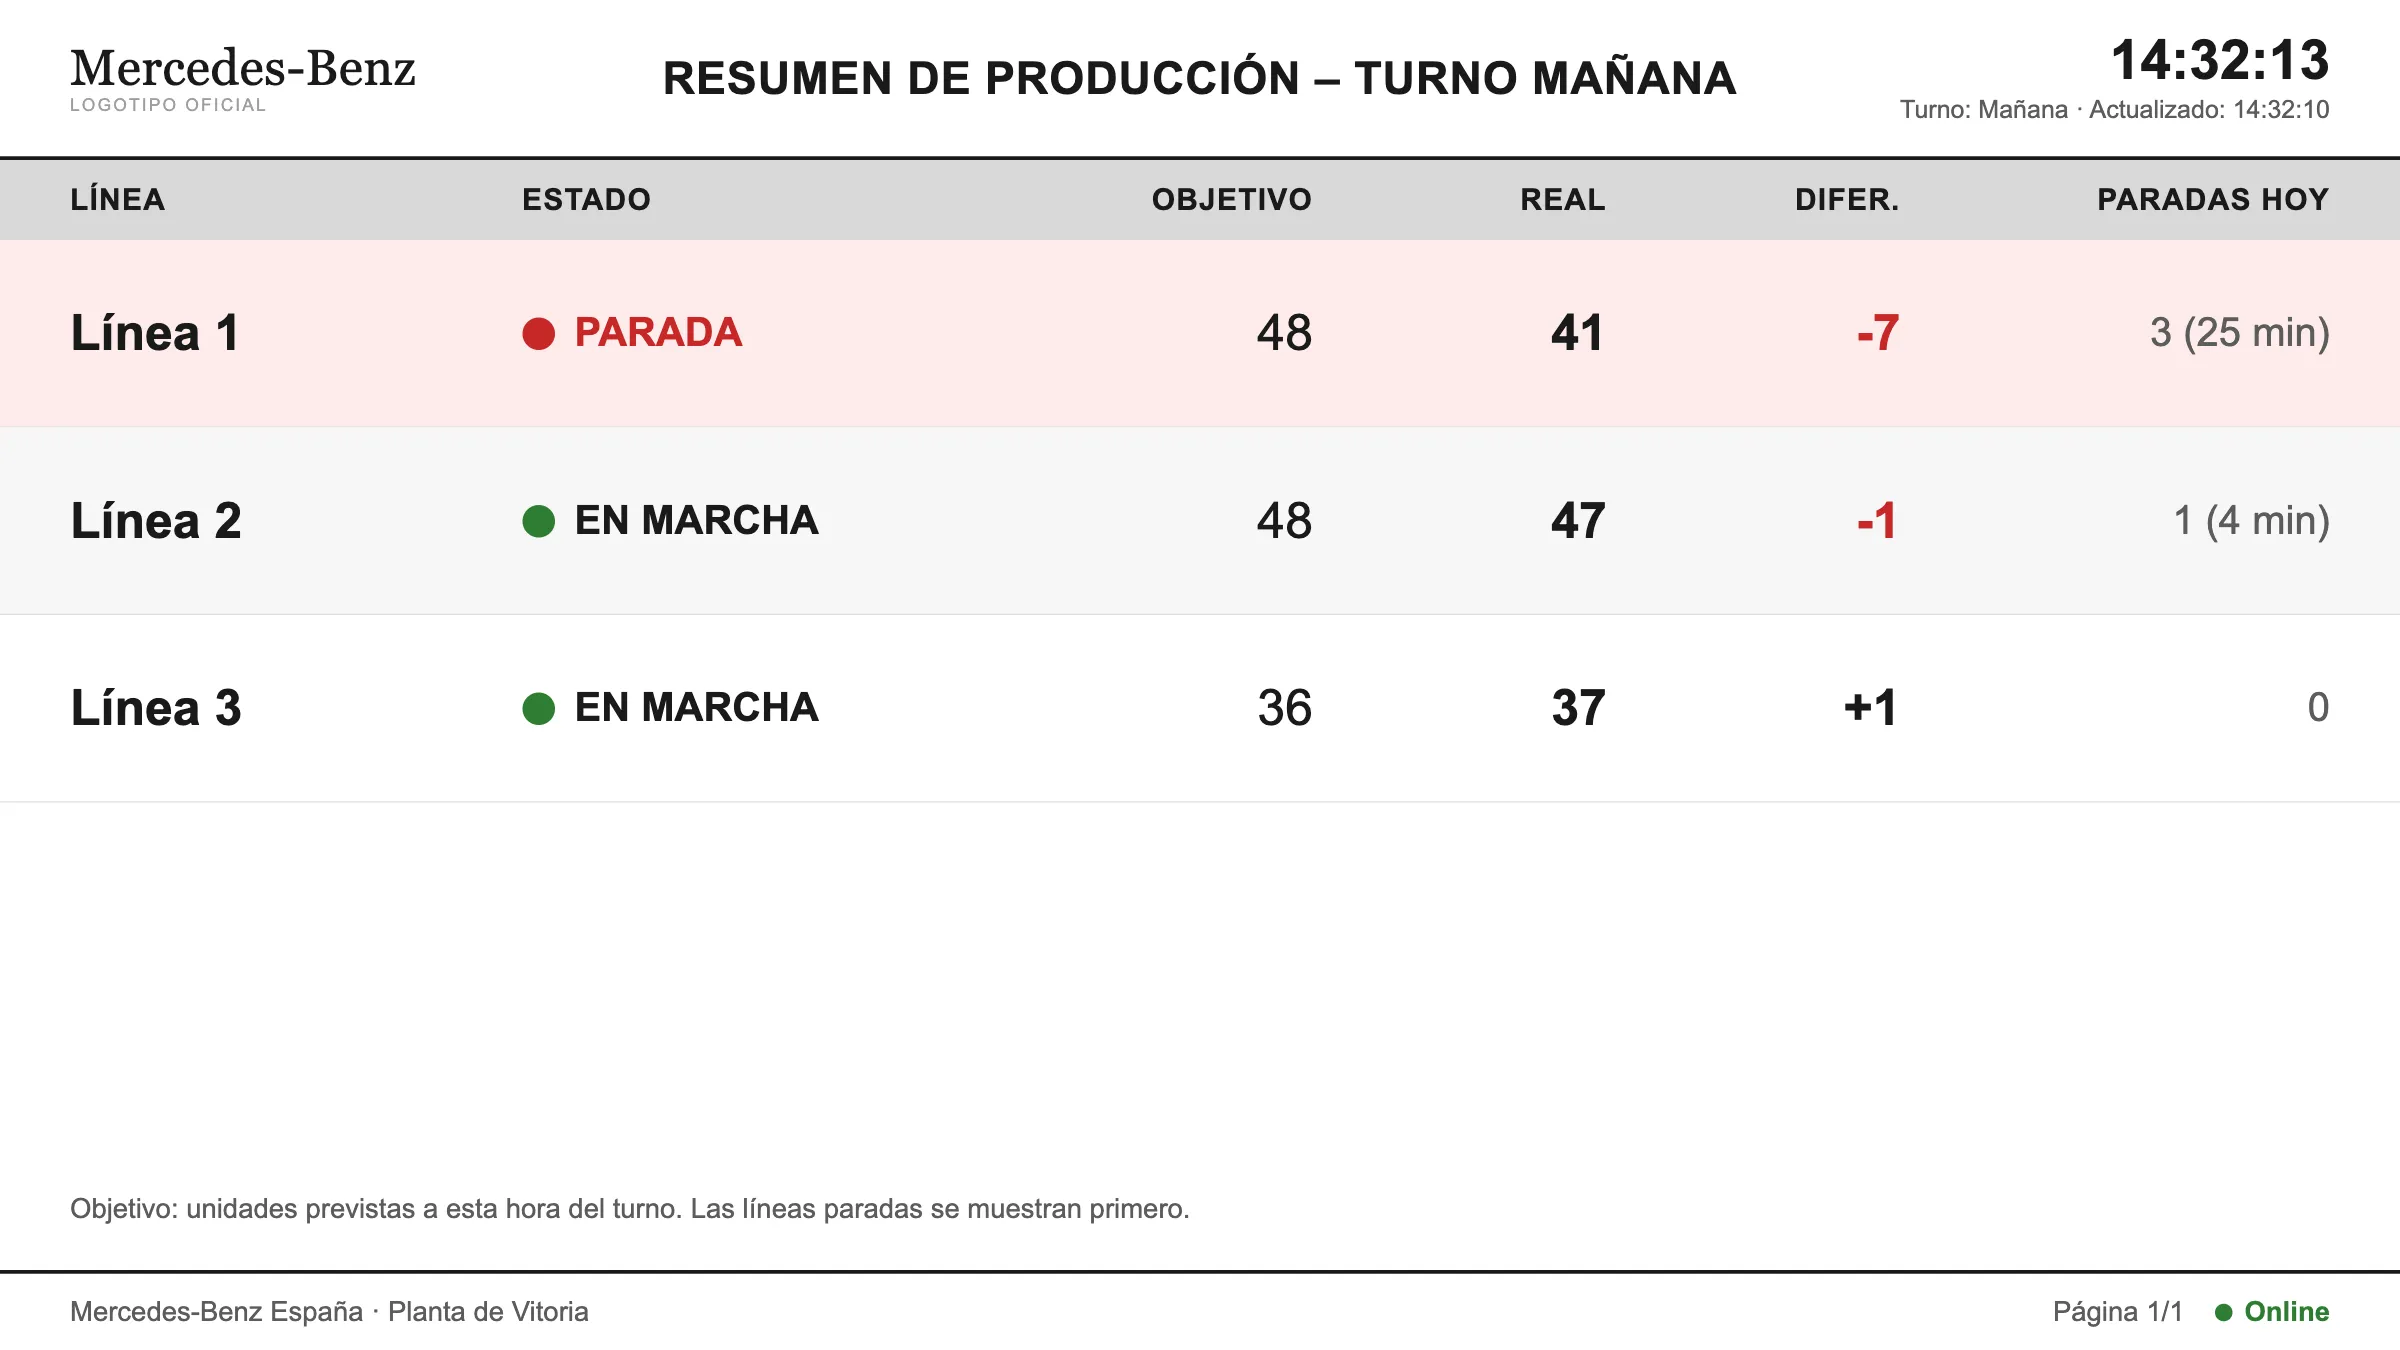
Line summary · supervisor screen
Per line: status, target at this point in the shift, actual, difference and the day’s stoppages. Stopped lines come first.
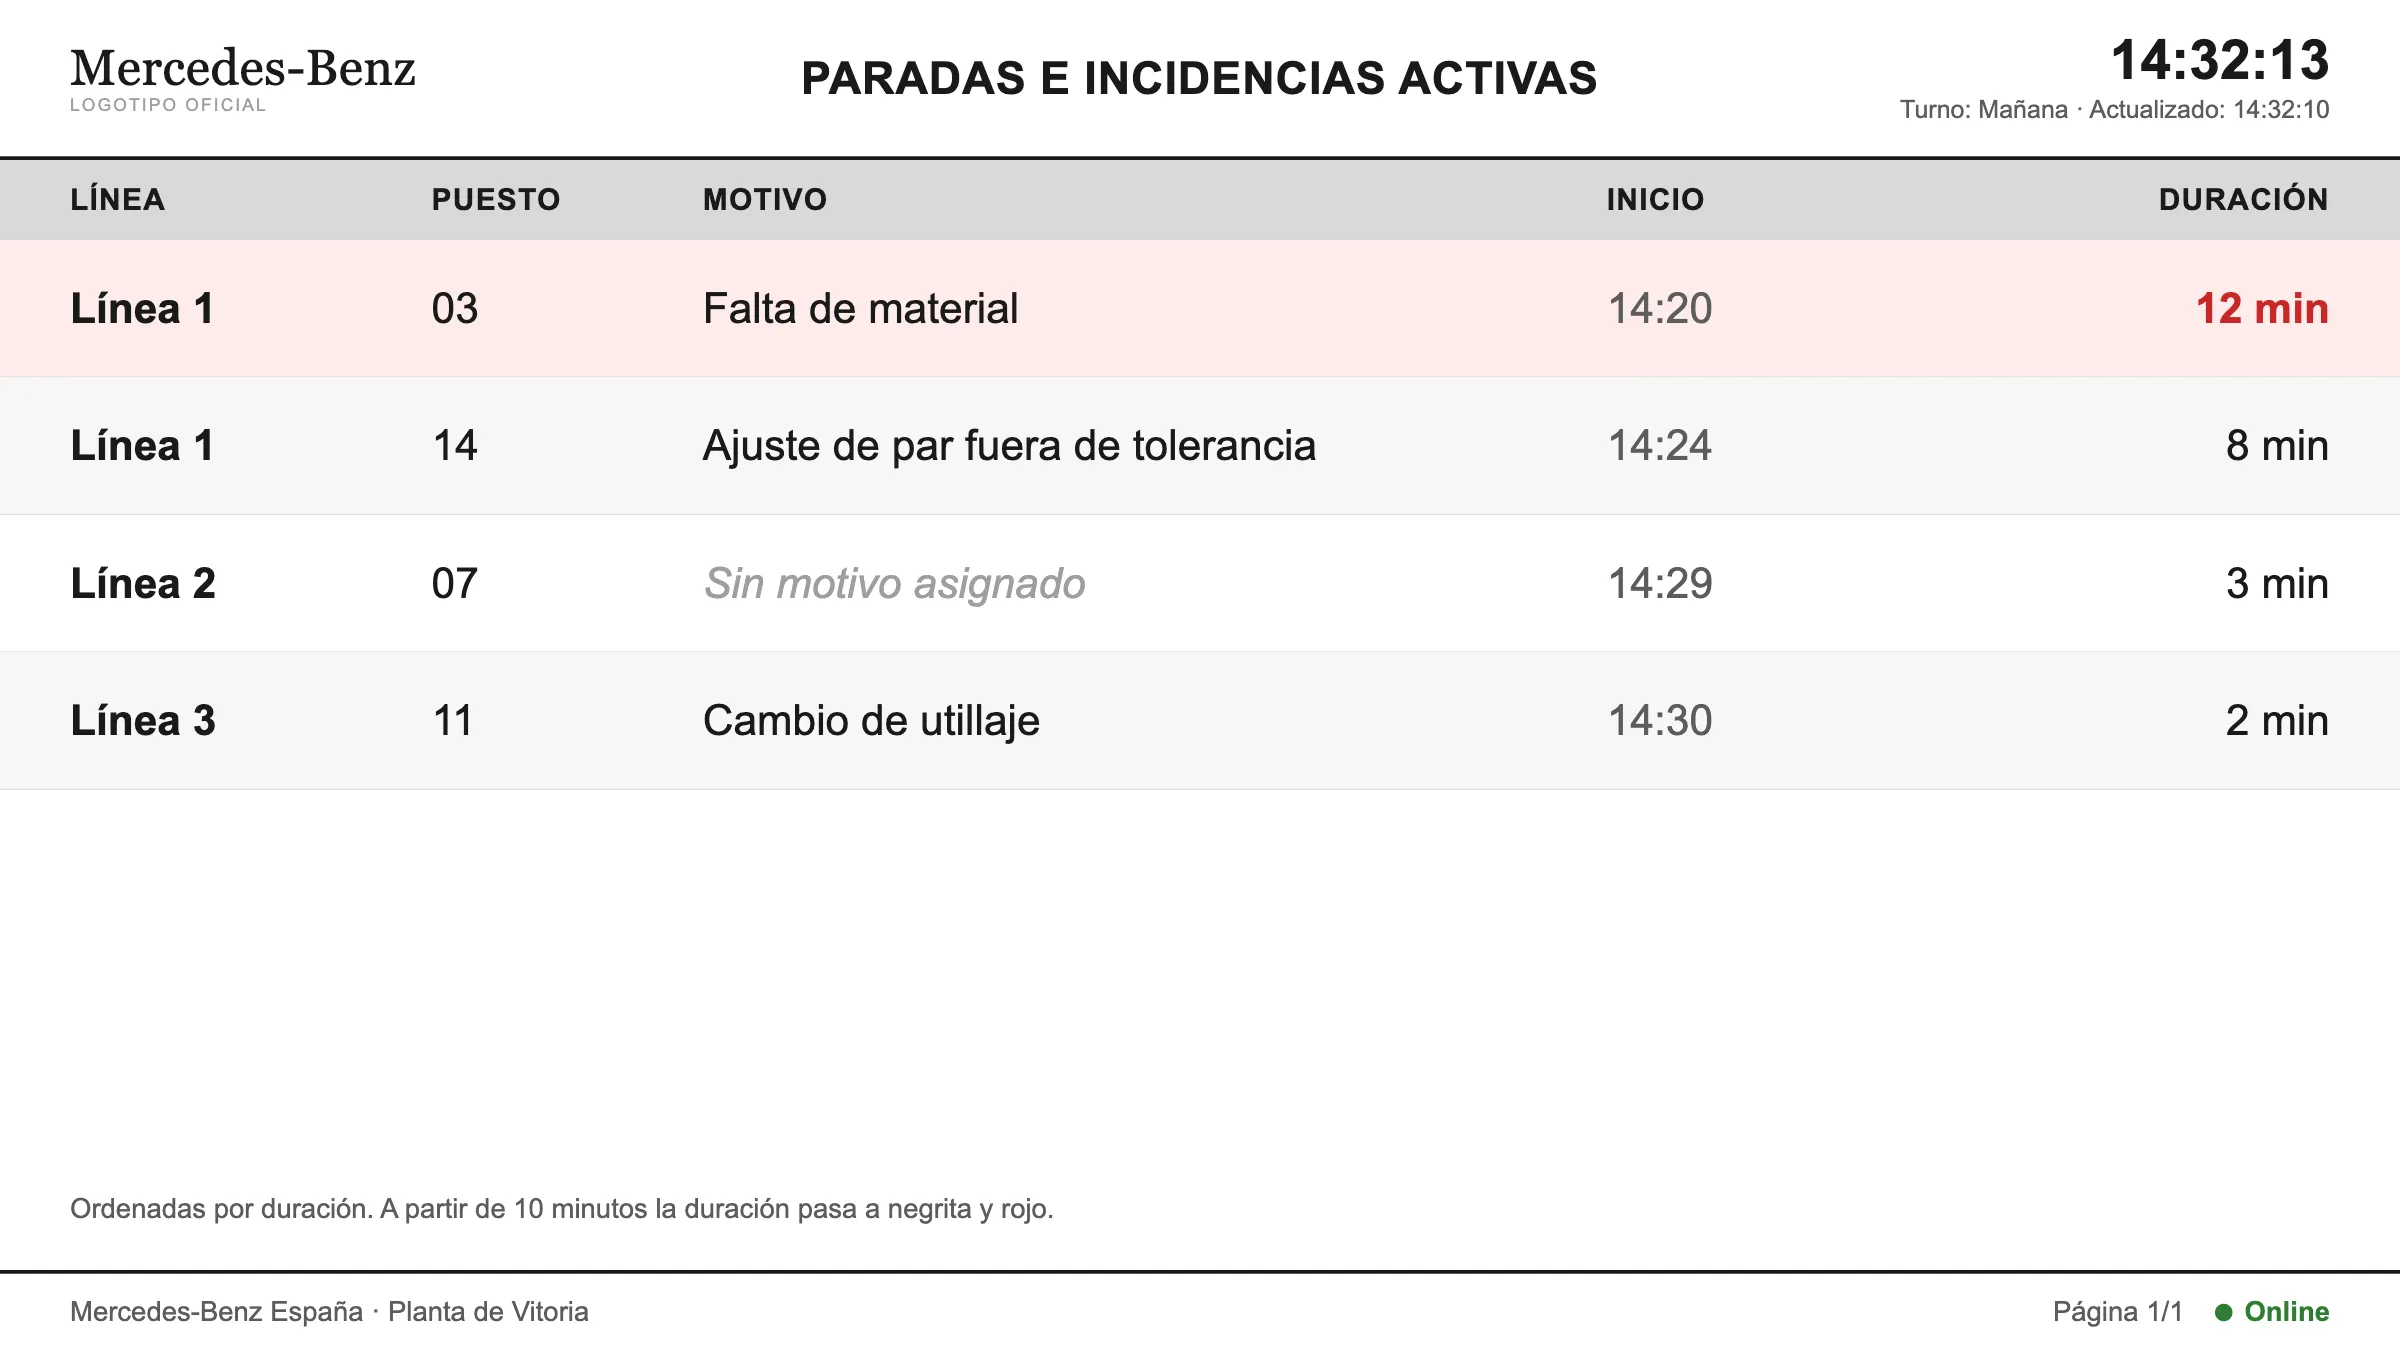
Active stoppages and incidents
Sorted by duration, with their reason. From 10 minutes on the duration turns bold and red; with no reason it reads "No reason assigned".
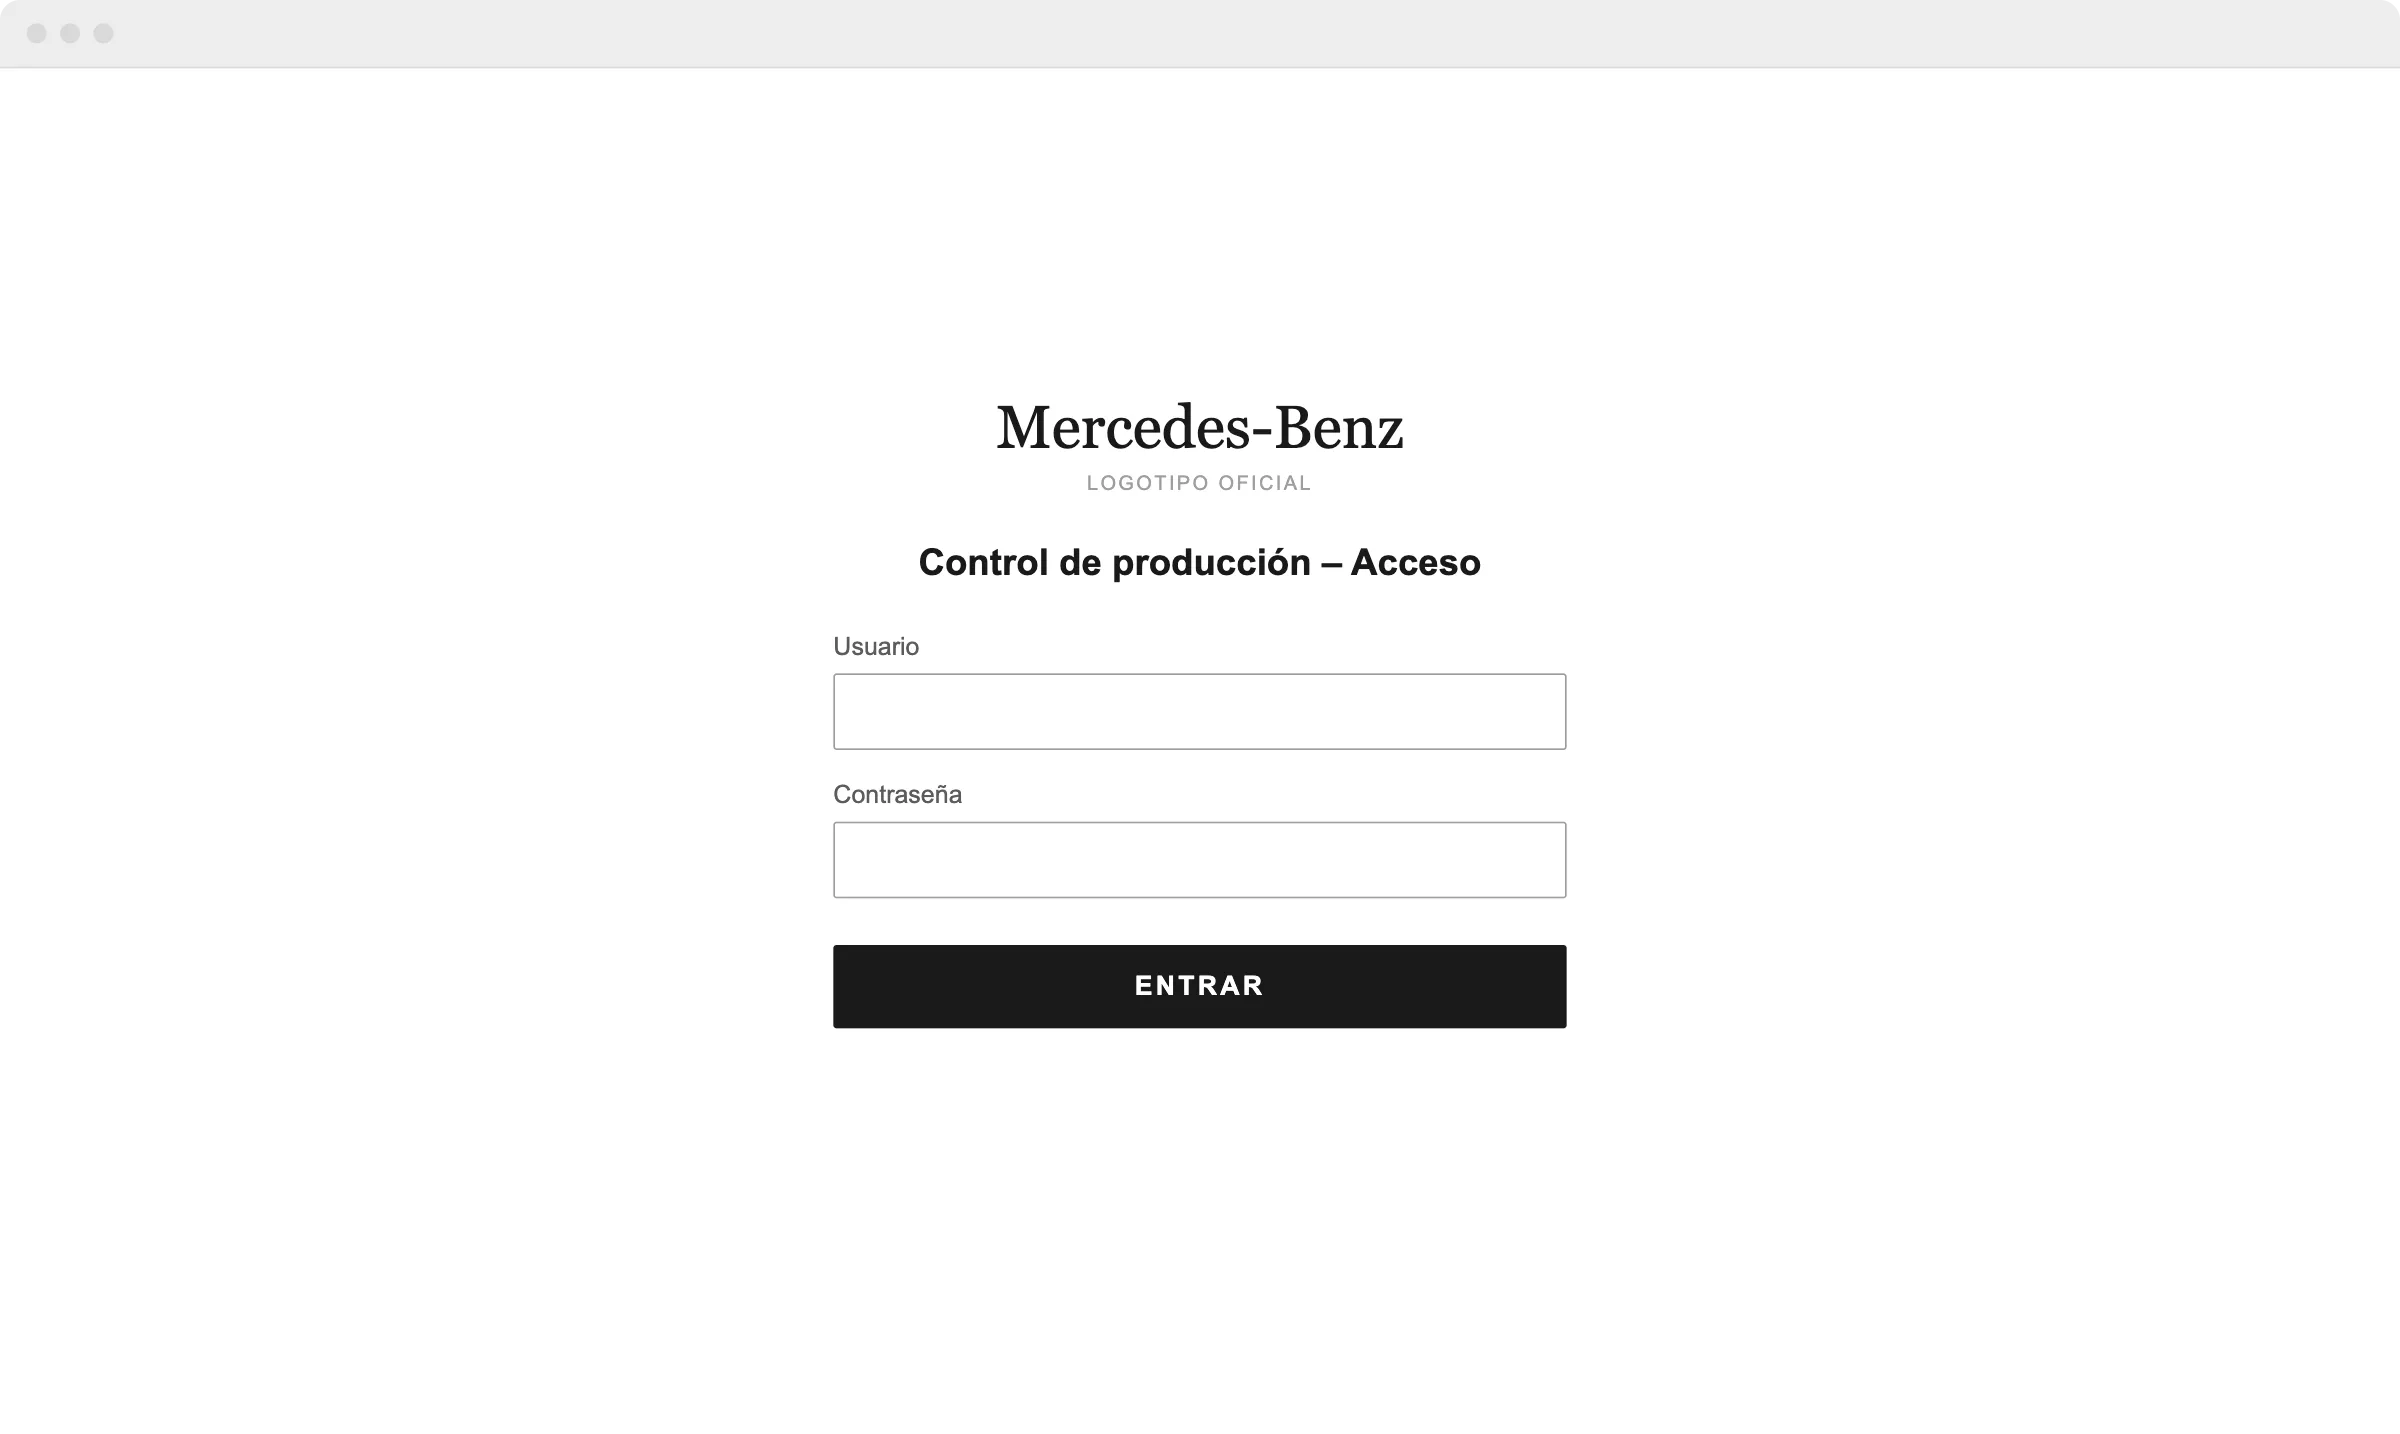
Remote access
The same application from outside the plant, with user and password.
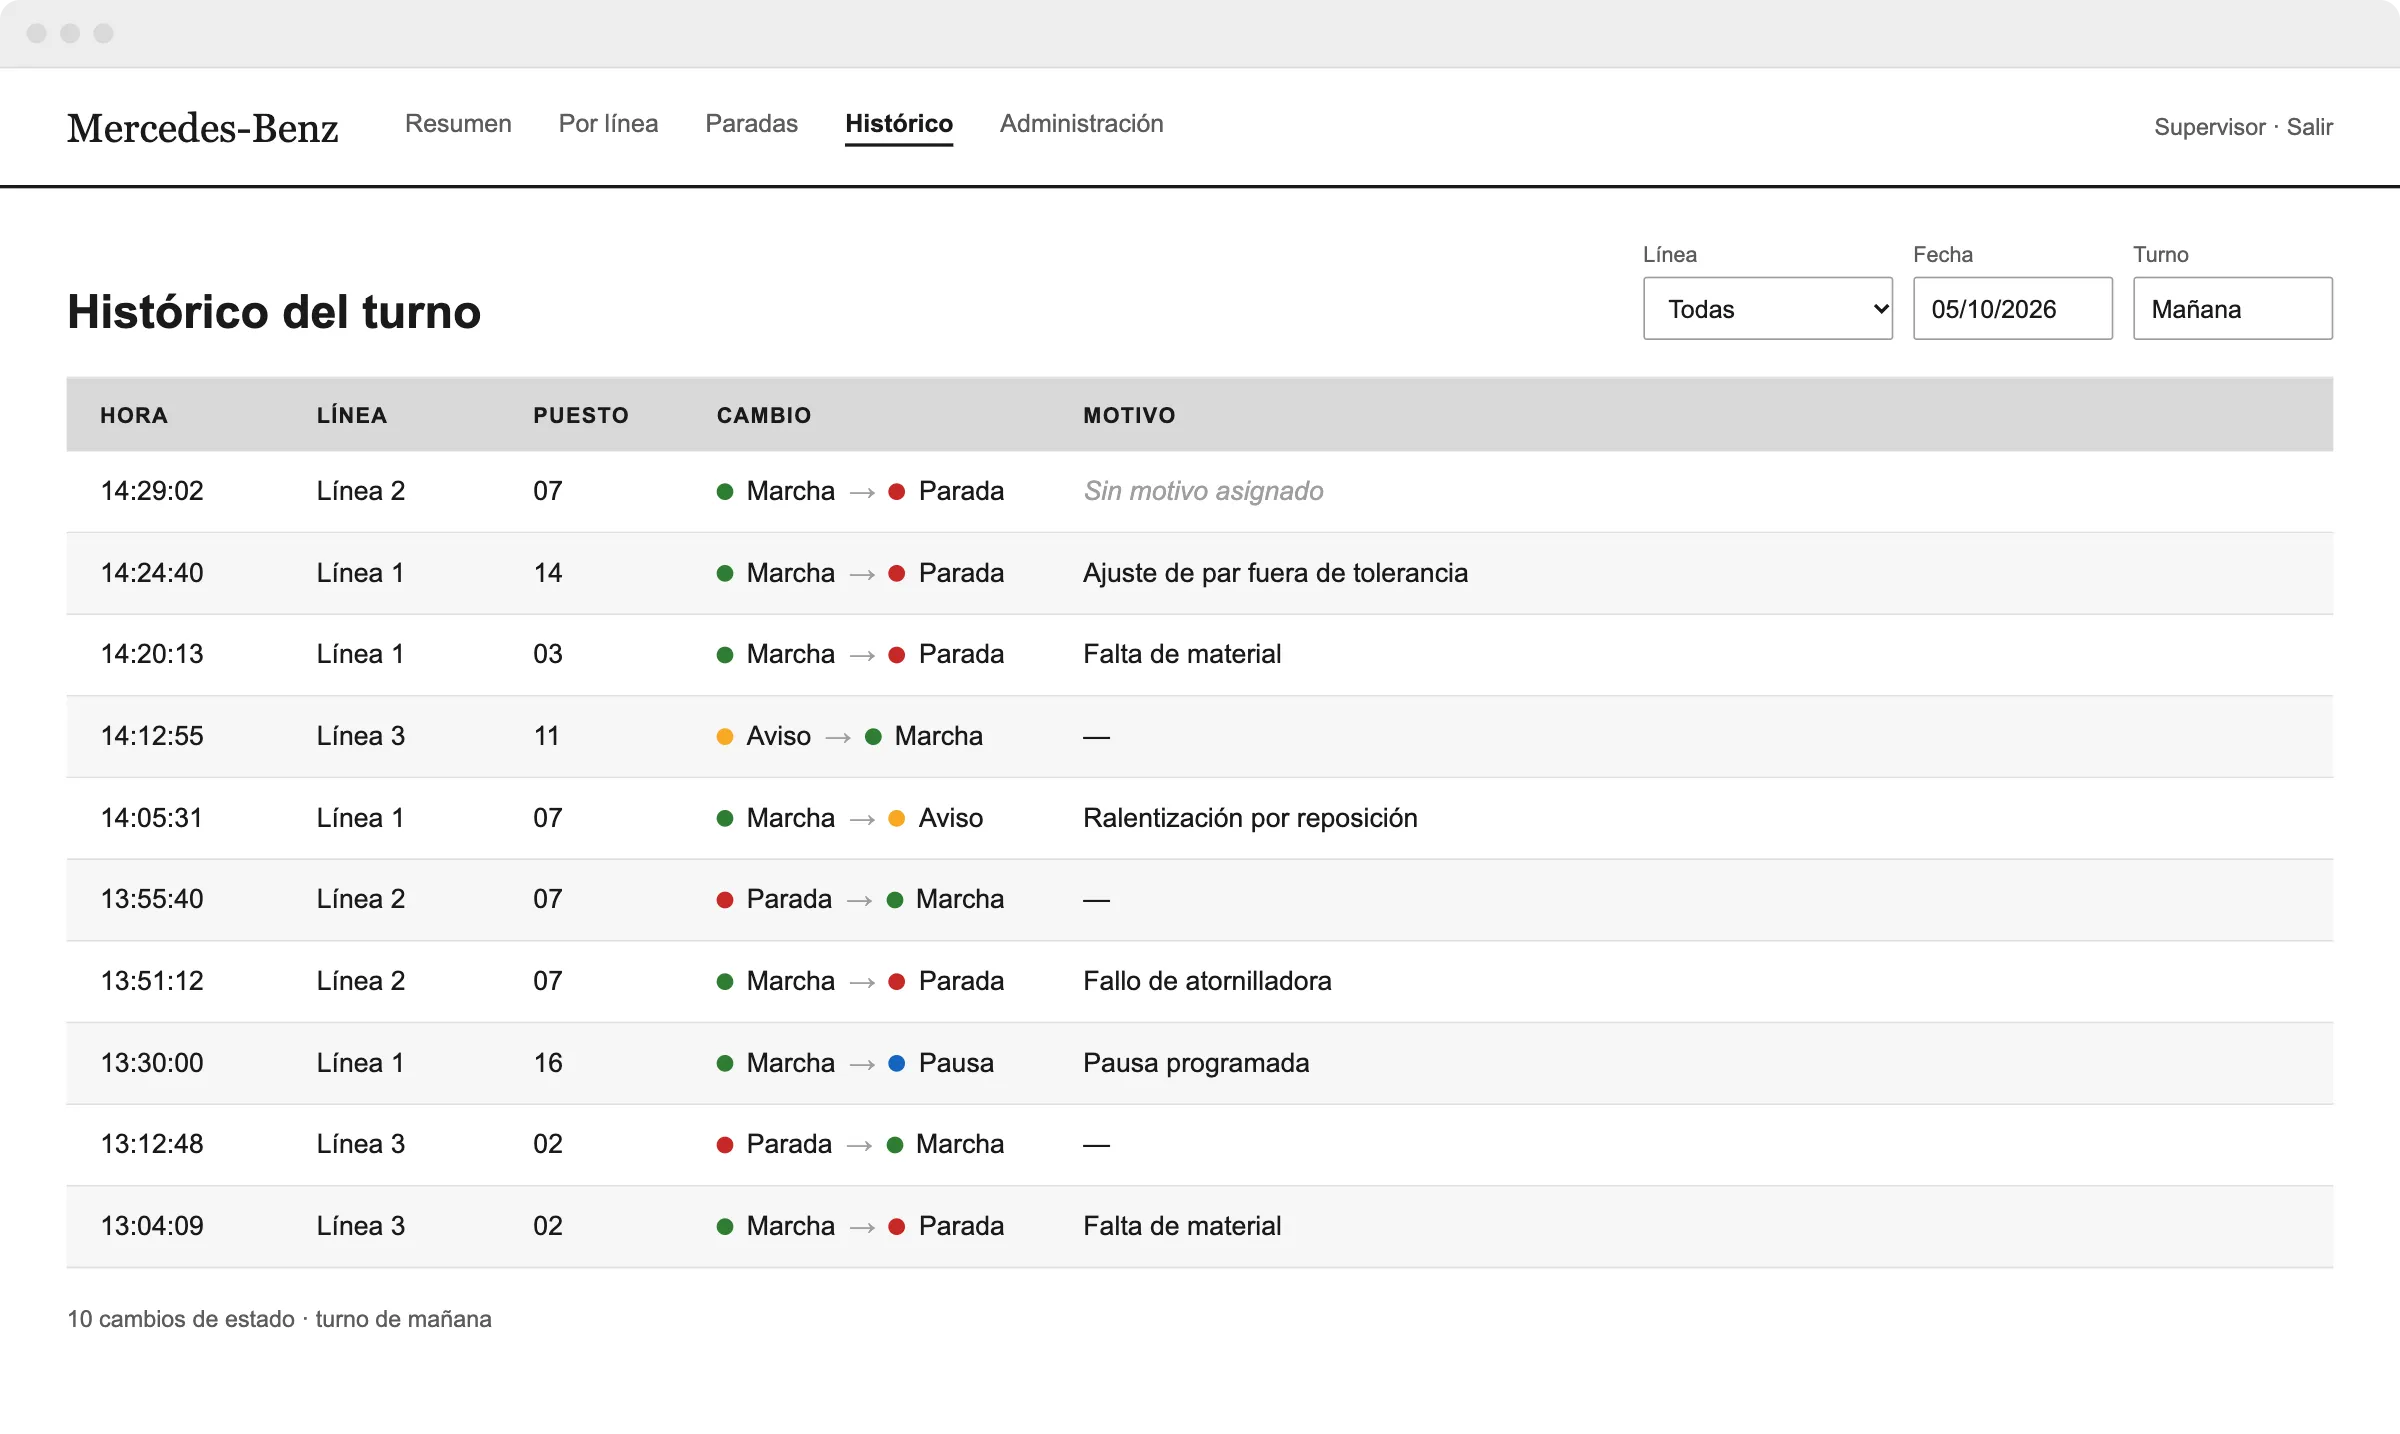
Shift history · remote web
Every status change with its time, line, station and reason, filterable by line, date and shift.
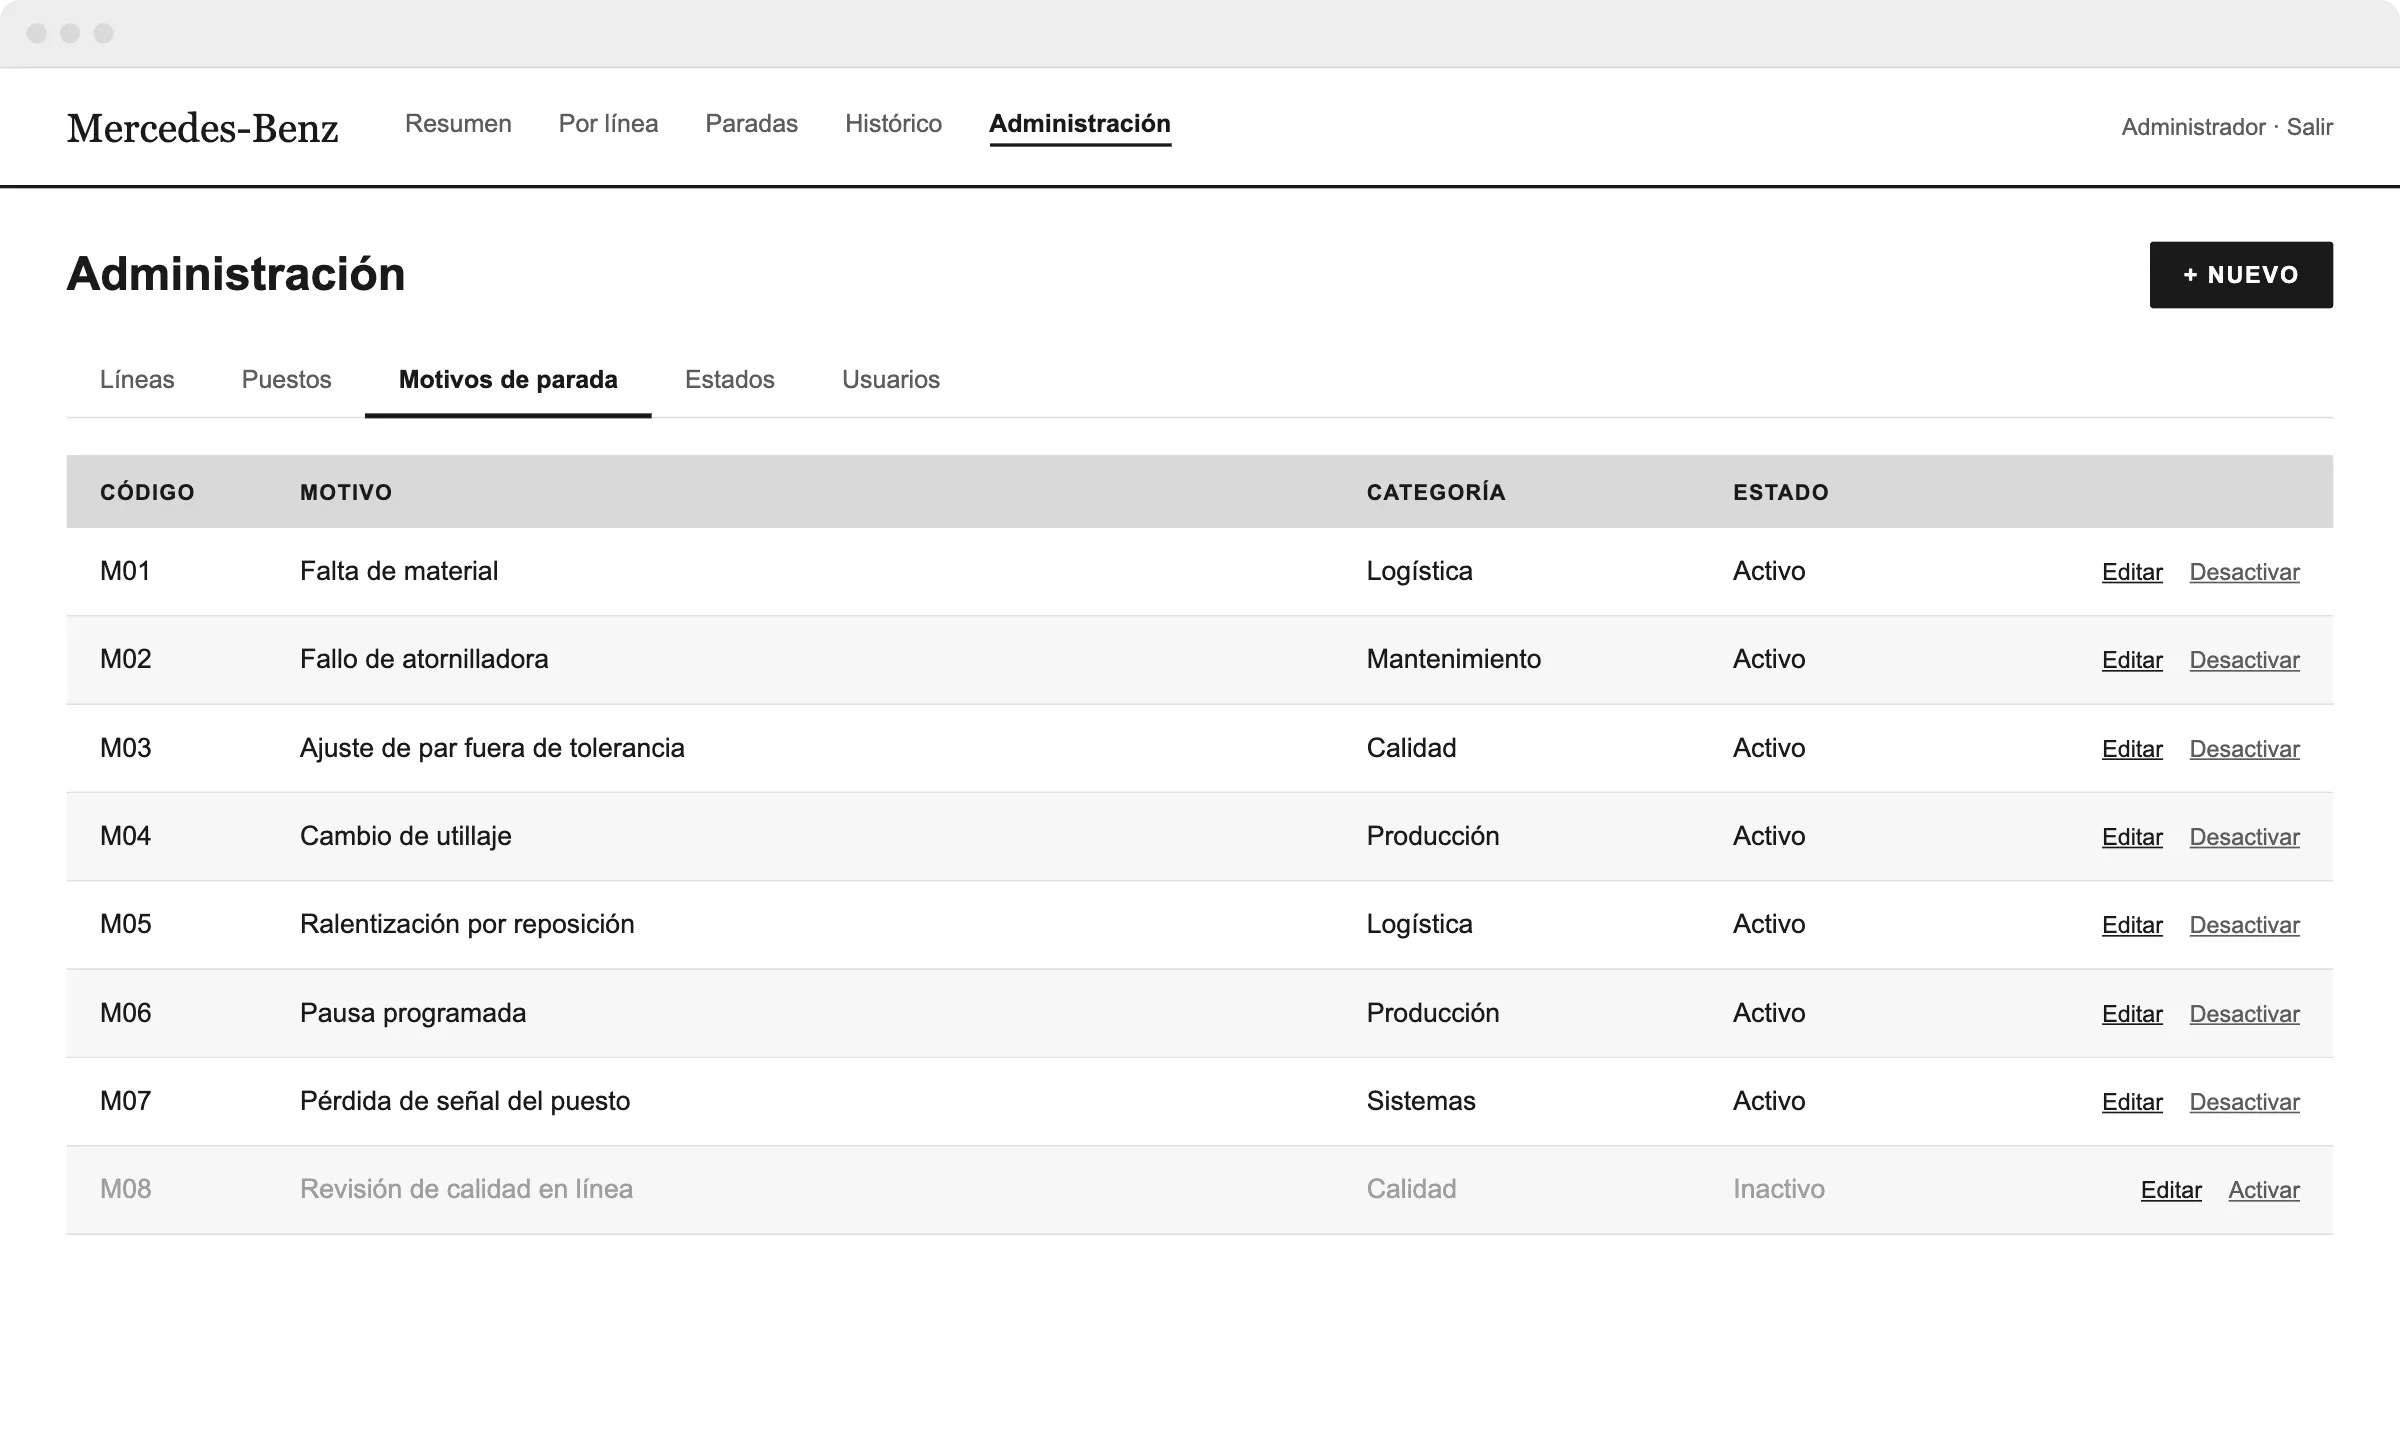
Administration
Lines, stations, stoppage reasons, statuses and users, for the administrator only.
The problem
Information about production progress, stoppages and incidents was scattered: part in the planning system, part in handwritten reports and part in spoken handovers between shifts. Those in charge needed quick answers to simple questions: which unit is at each station, which line is stopped and why, how far along we are against the shift target.
- No real-time visibility of the line's status.
- Stoppages were detected late, or by word of mouth.
- Information was only available in the plant; management and other departments had no direct access.
- Graphical panels were hard to read from a distance and unsuitable for showing many stations at once.
What we built
MySQL database
Stores the status of lines, stations, orders in progress, stoppages and incidents, with a timestamp for every change.
PHP layer
Queries the database, generates the list pages and exposes the data for the screens' periodic refresh.
HTML5 front end
Lightweight pages with a corporate stylesheet, designed for large screens in kiosk mode.
Remote access
The same application published at a URL reachable from outside the plant, with access control.
Stack
- HTML5
- PHP
- MySQL
Learnings
Simple reads better: the list format proved more useful on the shop floor than a flashy graphical panel.
Web technology makes deployment cheap: any screen with a browser became a display terminal.
Remote access changes who watches production: management started checking the status without relying on calls to the plant.
Data quality rules: the screens were only as useful as the source was at recording statuses and stoppage reasons.
Visual system
The interface is white, black and grey; colour is reserved for statuses and always comes with its text.
- Running#2E7D32
- Warning#F9A825
- Stopped#C62828
- No data#9E9E9E
- Scheduled break#1565C0
- Text#1A1A1A
- Table header#D9D9D9
- 03:12
Arial
Shop-floor tables, with tabular figures and large sizes to read from 5–10 metres